
由于真的没时间,这篇文章只说明如何搭建ELK系统,所以不得不先挖几个坑给自己
- 分词算法-trie树
- 索引技术-Lucene
- 搜索引擎的优缺点,我觉得在写完1,2两个知识点之后,这点其实一目了然
搭建ElasticSearch集群
搭建环境 Ubuntu 18.04.3 LTS 四台
架构: arm64
ip : 192.168.1.11(kibana), 192.168.1.13, 192.168.1.14, 192.168.1.15(es集群)
设置vm.max_map_count
设置每台的vm.max_map_count,该内核参数必须至少设置到262144
#打开系统配置文件
vim /etc/sysctl.conf
#增加配置
vm.max_map_count=262144
#保存
:wq
#执行命令
sysctl -w vm.max_map_count=262144
Docker方式
编辑docker-compose文件
- es01
version: '3'
services:
  es:
    image: docker.elastic.co/elasticsearch/elasticsearch:7.11.1-arm64
    container_name: es
    environment:
      - node.name=es01
      - cluster.name=es-docker-cluster
      - network.publish_host=192.168.1.13
      - discovery.seed_hosts=192.168.1.14,192.168.1.15
      - cluster.initial_master_nodes=es01,es02,es03
      - bootstrap.memory_lock=true
    ulimits:
      memlock:
        soft: -1
        hard: -1
    volumes:
      - data:/usr/share/elasticsearch/data
    ports:
      - 9200:9200
      - 9300:9300
volumes:
  data:
    driver: local
node.name: 该节点的名称
cluster.name: 集群名称
network.publish_host: 告知其他节点该节点通信的地址,不配会默认使用docker内部ip,造成无法通信问题
discovery.seed_hosts: 其他节点的地址
cluster.initial_master_nodes: 所有节点的名称
bootstrap.memory_lock: 是否锁住内存,避免交换(swapped)带来的性能损失
- es02
version: '3'
services:
  es:
    image: docker.elastic.co/elasticsearch/elasticsearch:7.11.1-arm64
    container_name: es
    environment:
      - node.name=es02
      - cluster.name=es-docker-cluster
      - network.publish_host=192.168.1.14
      - discovery.seed_hosts=192.168.1.13,192.168.1.15
      - cluster.initial_master_nodes=es01,es02,es03
      - bootstrap.memory_lock=true
    ulimits:
      memlock:
        soft: -1
        hard: -1
    volumes:
      - data:/usr/share/elasticsearch/data
    ports:
      - 9200:9200
      - 9300:9300
volumes:
  data:
    driver: local
- es03
version: '3'
services:
  es:
    image: docker.elastic.co/elasticsearch/elasticsearch:7.11.1-arm64
    container_name: es
    environment:
      - node.name=es03
      - cluster.name=es-docker-cluster
      - network.publish_host=192.168.1.15
      - discovery.seed_hosts=192.168.1.13,192.168.1.14
      - cluster.initial_master_nodes=es01,es02,es03
      - bootstrap.memory_lock=true
    ulimits:
      memlock:
        soft: -1
        hard: -1
    volumes:
      - data:/usr/share/elasticsearch/data
    ports:
      - 9200:9200
      - 9300:9300
volumes:
  data:
    driver: local
启动
docker-compose up -d
测试是否启动成功
curl -X GET "localhost:9200/_cat/nodes?v=true&pretty"
压缩包方式
下载压缩包并解压
#创建存放压缩包目录
mkdir -p /opt/server/packages && cd /opt/server/packages
#下载压缩包
wget https://artifacts.elastic.co/downloads/elasticsearch/elasticsearch-7.11.1-linux-aarch64.tar.gz
#解压
tar -xf elasticsearch-7.11.1-linux-aarch64.tar.gz
#重命名
mv elasticsearch-7.11.1-linux-aarch64 ../elasticsearch
编辑配置
-
创建存储目录
mkdir /opt/server/elasticsearch/data -
打开配置文件
vim /opt/server/elasticsearch/config/elasticsearch.yml -
修改配置
cluster.name: es-cluster node.name: es01 path.data: /opt/server/elasticsearch/data path.logs: /opt/server/elasticsearch/logs network.host: 0.0.0.0 http.port: 9200 discovery.seed_hosts: ["192.168.1.14", "192.168.1.15"] cluster.initial_master_nodes: ["es01", "es02","es03"] bootstrap.system_call_filter: false bootstrap.memory_lock: true -
修改JVM内存配置
#打开配置文件 vim /opt/server/elasticsearch/config/jvm.options #修改内存 -Xms8g -Xmx8g -
修改系统线程数
vim /etc/security/limits.conf #增加以下配置,注意*号要留着 * soft nofile 65536 * hard nofile 131072 * soft nproc 4096 * hard nproc 4096 * hard memlock unlimited * soft memlock unlimited -
锁定内存
vim /etc/systemd/system.conf #修改以下配置 DefaultLimitNOFILE=65536 DefaultLimitNPROC=32000 DefaultLimitMEMLOCK=infinity #关闭交换空间 swapoff -a -
修改虚拟内存大小,最开始已经加过了,这里记录一下
vim /etc/sysctl.conf
vm.max_map_count=262144
其他两台依样配置
启动
由于elasticsearch为了安全,禁止以root用户启动,我们需要创建新用户
-
创建用户
adduser es_user -
赋予用户目录权限
cd /opt/server chown -R es_user elasticsearch -
启动
#切换到es_user用户 su es_user #启动 nohup /opt/server/elasticsearch/bin/elasticsearch 2>&1 > /opt/server/elasticsearch/logs/std.out & -
查看日志
tail -100f /opt/server/elasticsearch/logs/std.out -
测试
curl -X GET "localhost:9200/_cat/nodes?v=true&pretty"
你以为这就结束了,密码还没设呢!
配置TLS
Elastic Stack安全功能使你可以加密来自elasticsearch集群的流量。使用传输层安全性(TLS)来保护连接
-
每个节点生成私钥(以下操作使用es_user用户)
cd /opt/server/elasticsearch #创建存放私钥目录 mkdir config/certs #生成ca文件,默认文件名(elastic-stack-ca.p12), 期间会要求输入自己的密码,记得拿小本本记下 ./bin/elasticsearch-certutil ca #使用ca生成私钥,默认文件名(elastic-certificates.p12),期间会要求输入自己的密码,记得拿小本本记下 ./bin/elasticsearch-certutil cert --ca elastic-stack-ca.p12 #将生成的密钥移到存放目录下 mv elastic-certificates.p12 config/certs/ -
修改配置
vim /opt/server/elasticsearch/config/elasticsearch.yml
增加以下配置, 启用TLS并指定访问节点证书所需的信息
http.cors.enabled: true http.cors.allow-origin: "*" http.cors.allow-headers: Authorization xpack.security.enabled: true xpack.security.transport.ssl.enabled: true xpack.security.transport.ssl.verification_mode: certificate xpack.security.transport.ssl.keystore.path: certs/elastic-certificates.p12 xpack.security.transport.ssl.truststore.path: certs/elastic-certificates.p12 -
配置key-store
#输入生成密钥时使用的密码 ./bin/elasticsearch-keystore add xpack.security.transport.ssl.keystore.secure_password ./bin/elasticsearch-keystore add xpack.security.transport.ssl.truststore.secure_password -
重启
ps aux | grep java | grep elastic
kill -9 pid
nohup /opt/server/elasticsearch/bin/elasticsearch 2>&1 > /opt/server/elasticsearch/logs/std.out &
注意:其他两台需要使用同一份密钥文件(elastic-certificates.p12),可将这台服务器的文件传到其他两台进行操作
配置HTTP SSL(可选)
开启SSL意味着客户端访问elasticsearch时必须提供相应的证书签名
-
修改配置
xpack.security.http.ssl.enabled: true xpack.security.http.ssl.keystore.path: certs/elastic-certificates.p12 xpack.security.http.ssl.truststore.path: certs/elastic-certificates.p12 -
添加key
#密码与生成p12私钥时的密码保持一致 bin/elasticsearch-keystore add xpack.security.http.ssl.keystore.secure_password bin/elasticsearch-keystore add xpack.security.http.ssl.truststore.secure_password -
重启
设置密码
使用命令./bin/elasticsearch-setup-passwords interactive,将出现以下交互情况
Initiating the setup of passwords for reserved users elastic,apm_system,kibana,kibana_system,logstash_system,beats_system,remote_monitoring_user.
You will be prompted to enter passwords as the process progresses.
Please confirm that you would like to continue [y/N]y


Enter password for [elastic]:
Reenter password for [elastic]:
Enter password for [apm_system]:
Reenter password for [apm_system]:
Passwords do not match.
Try again.
Enter password for [apm_system]:
Reenter password for [apm_system]:
Enter password for [kibana_system]:
Reenter password for [kibana_system]:
Enter password for [logstash_system]:
Reenter password for [logstash_system]:
Enter password for [beats_system]:
Reenter password for [beats_system]:
Enter password for [remote_monitoring_user]:
Reenter password for [remote_monitoring_user]:
Changed password for user [apm_system]
Changed password for user [kibana_system]
Changed password for user [kibana]
Changed password for user [logstash_system]
Changed password for user [beats_system]
Changed password for user [remote_monitoring_user]
Changed password for user [elastic]
每台服务器都要整一遍,这里直接把我整吐了
安装中文分词插件
下载插件
release: https://github.com/medcl/elasticsearch-analysis-ik/releases
下载与elastic相对应的版本插件
安装
#在plugins目录下新建目录 ik
cd plugins
mkdir ik
#解压中文分词插件
unzip elasticsearch-analysis-ik-7.11.1.zip
重启es即可
安装kibana
下载安装包并解压
wget https://artifacts.elastic.co/downloads/kibana/kibana-7.11.1-linux-aarch64.tar.gz
#解压
tar -xf kibana-7.11.1-linux-aarch64.tar.gz
#重命名
mv kibana-7.11.1-linux-aarch64 kibana
修改配置
vim kibana/config/kibana.yml
server.port: 5601
server.host: "192.168.1.11"
elasticsearch.hosts: ["http://192.168.1.13:9200","http://192.168.1.14:9200","http://192.168.1.15:9200"]
elasticsearch.username: "kibana"
elasticsearch.password: "your_password"
i18n.locale: "zh-CN"
配置SSL(可选)
如果elasticsearch配置了HTTP SSL,则kibana也要有相应的配置
-
将elasticsearch证书传输到kibana服务器
-
由于kibana为node写的,不支持p12证书,将证书转为pem格式
openssl pkcs12 -in elastic-stack-ca.p12 -out elastic-stack-ca.pem -
修改配置
#hosts修改为https
elasticsearch.hosts: ["https://192.168.1.13:9200","https://192.168.1.14:9200","https://192.168.1.15:9200"]
elasticsearch.ssl.certificateAuthorities: [ "/opt/server/kibana/kibana-7.11.1-linux-aarch64/config/elastic-stack-ca.pem" ]
elasticsearch.ssl.verificationMode: certificate
#加密key,不能少于32位
xpack.encryptedSavedObjects.encryptionKey: 1234567891112131415161718192021222324
xpack.security.encryptionKey: 1234567891112131415161718192021222324
xpack.reporting.encryptionKey: 1234567891112131415161718192021222324
启动
#增加用户
adduser kibana_user
#增加权限
chown -R kibana_user kibana-7.11.1-linux-aarch64
#切换用户
su es_user
#启动
nohup ./bin/kibana 2>&1 &
查看控制台
kibana用户在该版本已过时,不能再用于登陆控制台,只能用于与elasticsearch通信,所以我们使用elastic账户登陆
关于kibana的使用
安装Filebeat
下载并解压
cd /opt/server
wget https://artifacts.elastic.co/downloads/beats/filebeat/filebeat-7.11.1-linux-x86_64.tar.gz
tar -xf filebeat-7.11.1-linux-x86_64.tar.gz
mv filebeat-7.11.1-linux-x86_64 filebeat
修改配置
filebeat.inputs:
- type: log
  #启用该type配置
  enabled: true
  #收集的日志地址
  paths:
    - /opt/docker_volumes/ih-front-center/logs/ih-front-center/log.out
  #排除匹配正则的行,该配置为排除前缀为DBG的行
  exclude_lines: ['^DBG']
  #包含匹配正则的行,该配置为读取包含hello的行,如果inclue和exclue都配置了,那么会先inclued再exclued
  include_lines: ['hello']
  #排除匹配正则的文件
  prospector.scanner.exclude_files: ['.gz$']
  #默认这个值是FALSE的,也就是我们的json日志解析后会被放在json键上。设为TRUE,所有的keys就会被放到根节点
  #如果日志不是json格式,请使用false
  json.keys_under_root: true
  #把filebeat默认的key值覆盖
  #如果日志不是json格式,请使用false
  json.overwrite_keys: true
  #属性,index为自定义字段
  fields:
    index: 'ih-front-center-ljey-staging'
  #匹配多行,该正则表示以空格开头,后面跟 at 或者 ... 的行或者以 Caused by: 开头的行将合并到上一行,主要是为了匹配java的异常信息
  multiline.pattern: '^[[:space:]]+(at|\.{3})\b|^Caused by:'
  #定义模式是否是否定,就是上面这个正则是直接匹配,还是匹配后取反
  multiline.negate: false
  #如何把多行合并成一个事件 after 或者 before
  #三个配置合在一起表示 多个以空格或者Casued开头的行合并到上一行,如果有过滤规则就是合并后进行过滤
  multiline.match: after
- type: log
  enabled: true
  paths:
    - /opt/logs/ih-inquiry-center/ih-inquiry-center/log.out
  exclude_lines: ['DEBUG']
  include_lines: ['^ERR', '^WARN']
  prospector.scanner.exclude_files: ['.gz$']
  json.keys_under_root: true
  fields:
    index: 'ih-inquiry-center-staging'
  multiline.pattern: '^\s+(at|\.{3})\b|^Caused by:'
  multiline.negate: true
  multiline.match: after
#组件配置地址
filebeat.config.modules:
  path: ${path.config}/modules.d/*.yml
  reload.enabled: false
#分片数量
setup.template.settings:
  index.number_of_shards: 6
#kibana地址
setup.kibana:
  host: "192.168.1.11:5601"
#es地址
output.elasticsearch:
  hosts: ["192.168.1.13:9200","192.168.1.14:9200","192.168.1.15:9200"]
  #默认索引,如果下面的indices一个都没生效就用这个
  index: "ihis-staging-%{+yyyy.MM.dd}"
  indices:
  	#索引名称
    - index: "ih-front-center-ljey-staging-%{+yyyy.MM.dd}"
      #当匹配到fields index值为ih-front-center-ljey-staging时生效,与上面配置呼应
      when.contains:
        fields:
          index: 'ih-front-center-ljey-staging'
    - index: "ih-inquiry-center-staging-%{+yyyy.MM.dd}"
      when.contains:
        fields:
          index: 'ih-inquiry-center-staging'
  username: "elastic"
  password: "elastic"
#自定义索引模板
setup.template.name: "his-log"
setup.template.pattern: "his-log-*"
setup.template.enabled: true
setup.template.overwrite: true
#解除限制,否则无法使用自定义模板
setup.ilm.enabled: false
processors:
  - add_host_metadata:
      when.not.contains.tags: forwarded
  - add_cloud_metadata: ~
  - add_docker_metadata: ~
  - add_kubernetes_metadata: ~
启动
nohup ./filebeat -e -c filebeat.yml 2>&1 &
配置索引
-
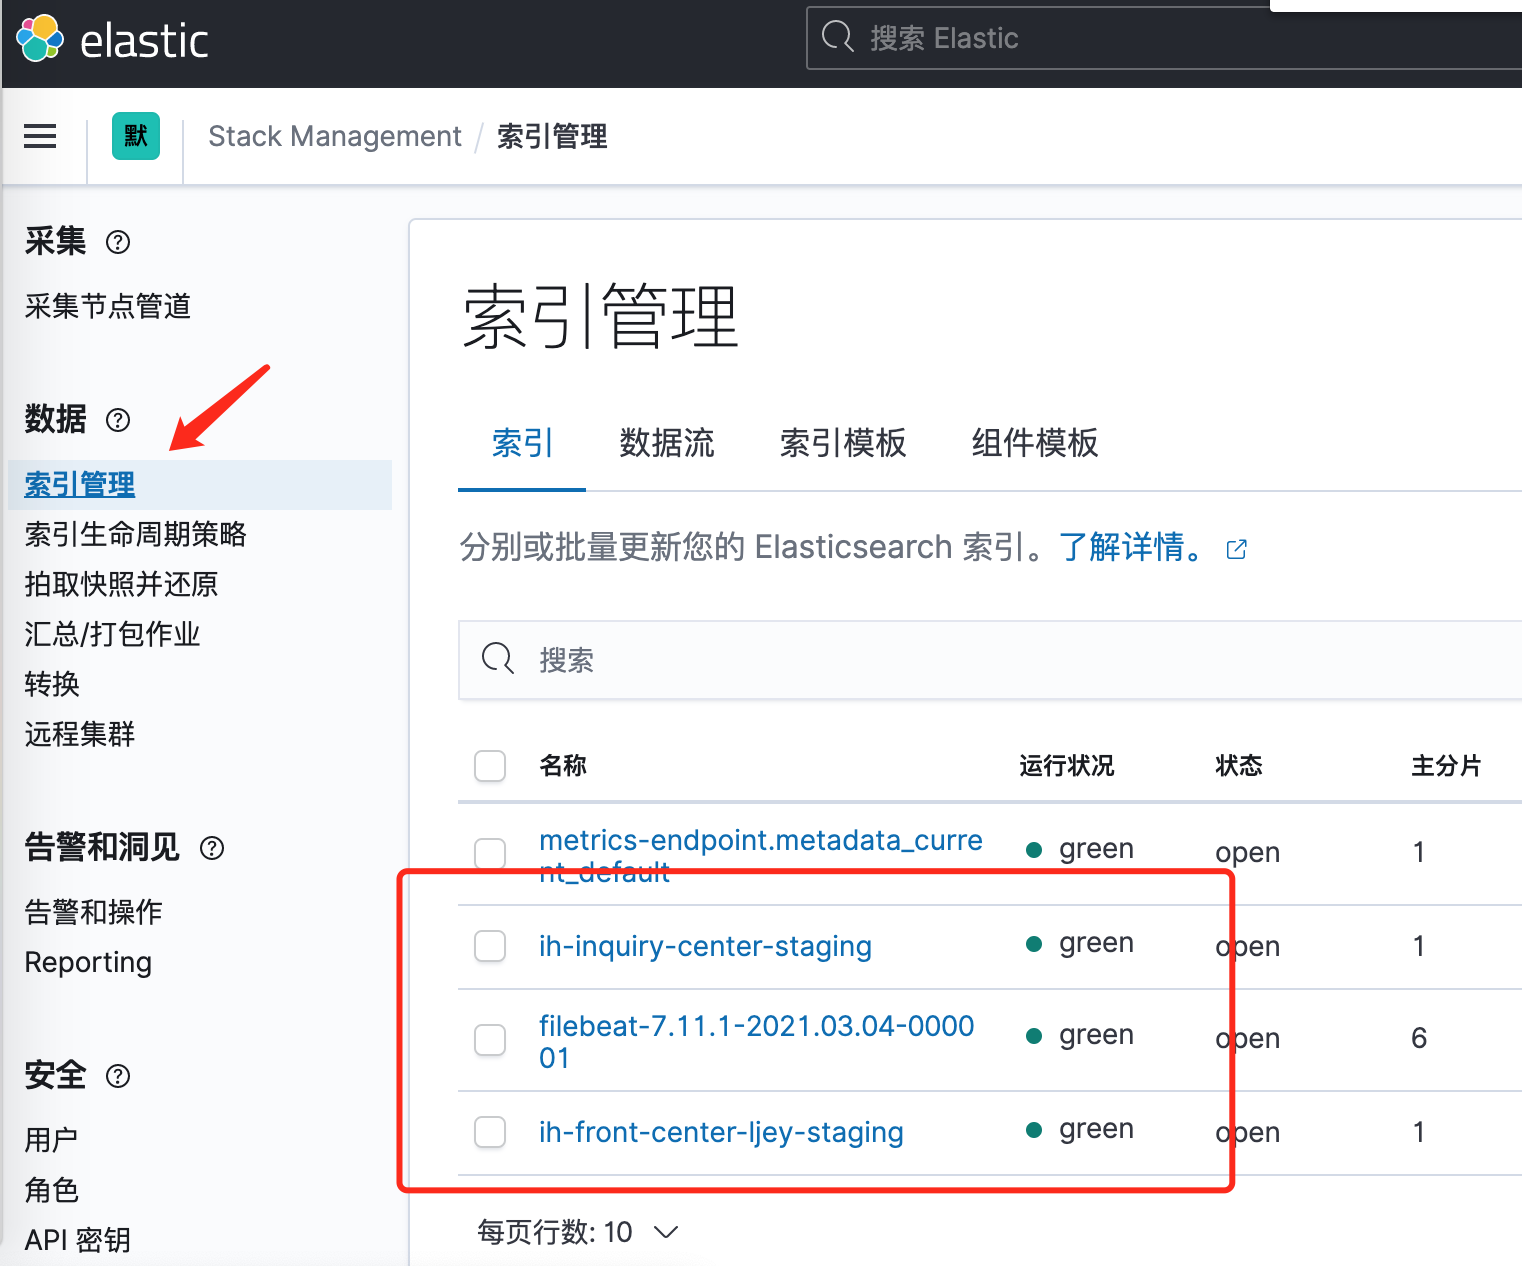
打开kibana,选择Stack Management

-
查看索引管理, 可以看到索引已经建立了
-
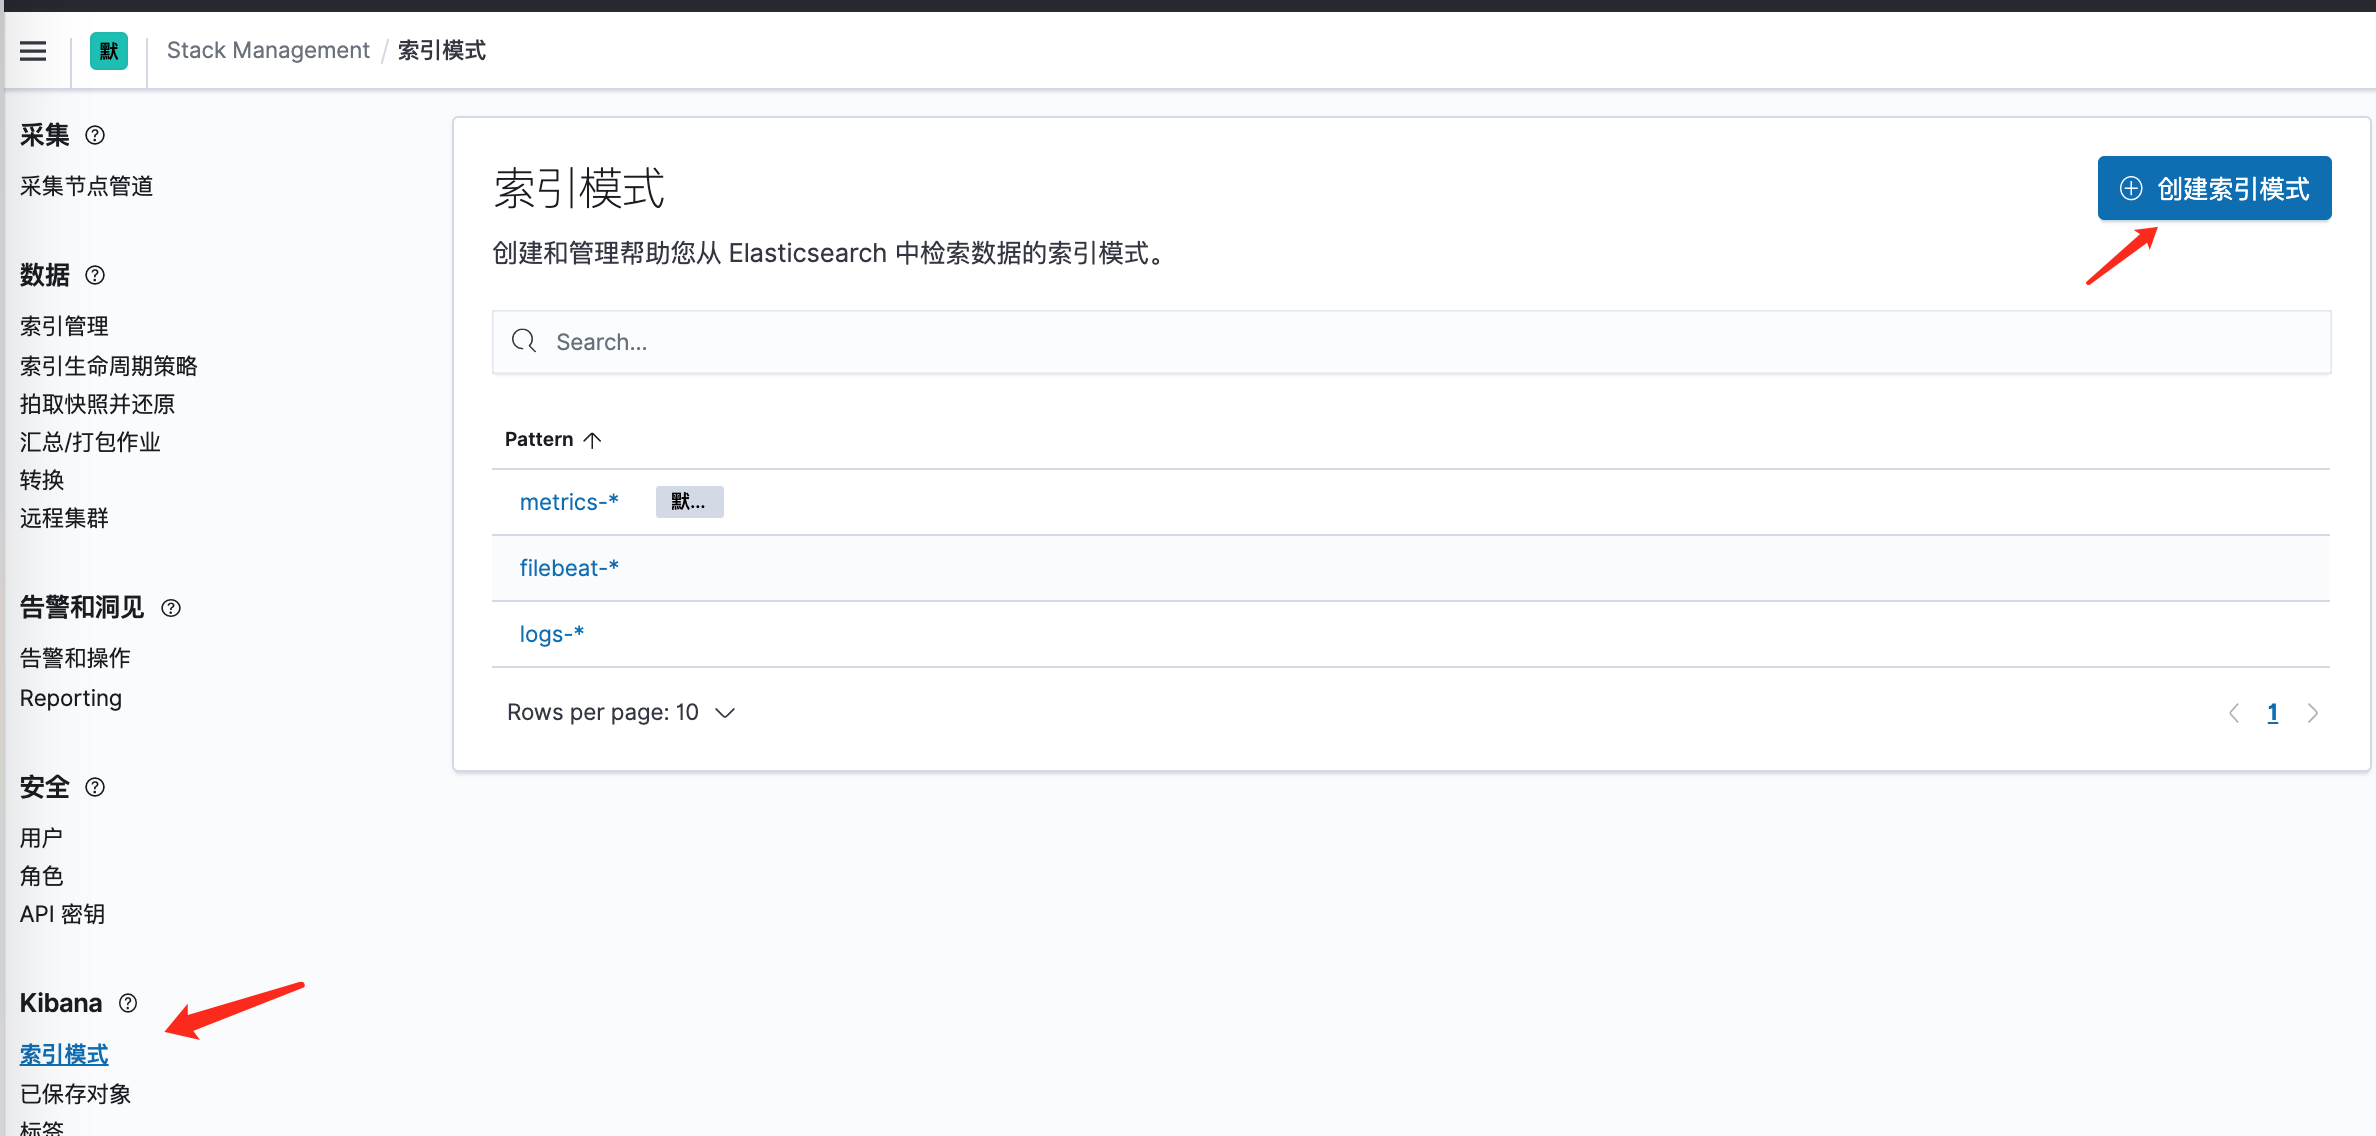
创建索引模式
-
创建索引模式

点击下一步,选择时间字段
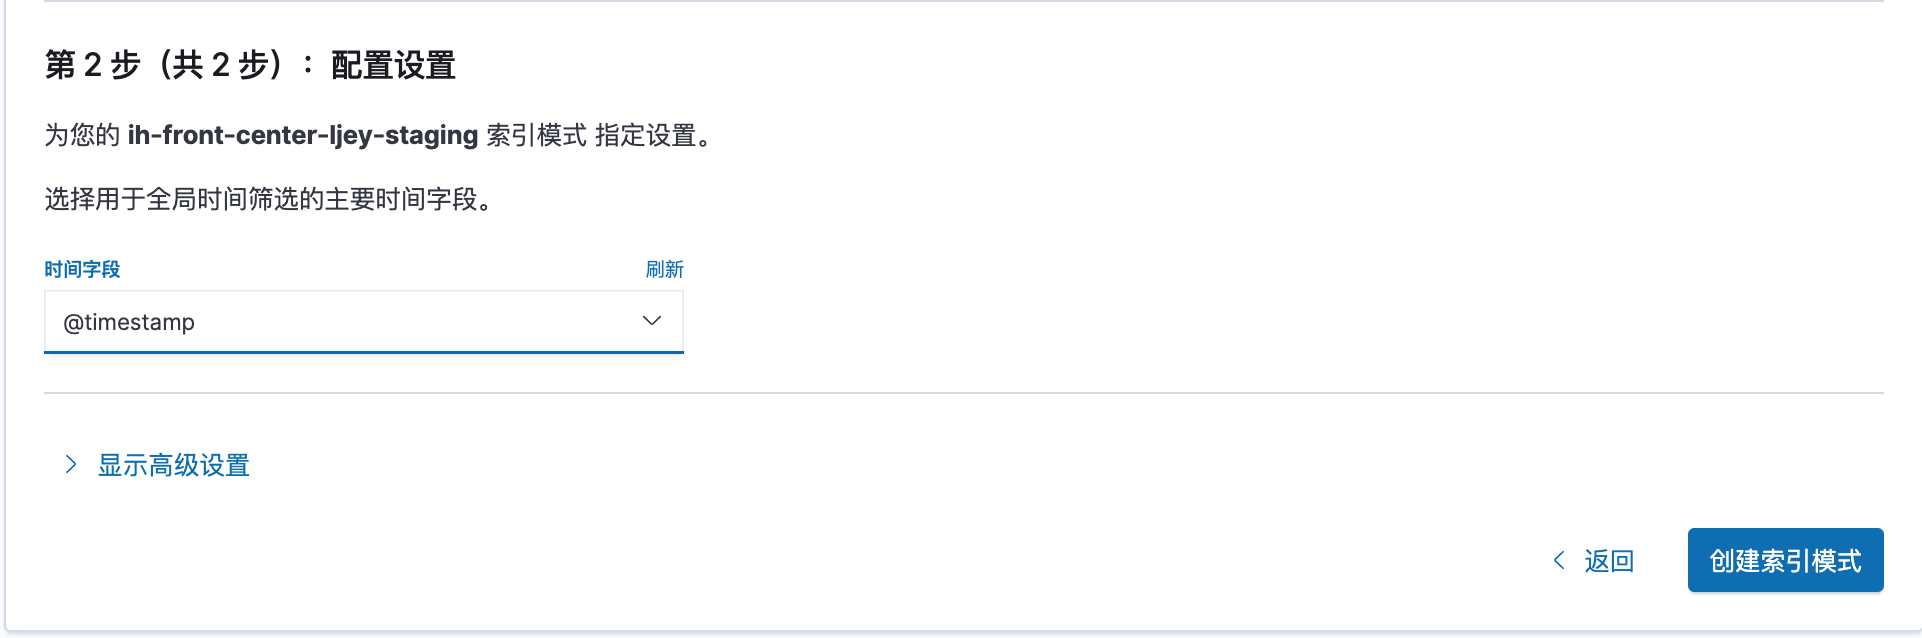
-
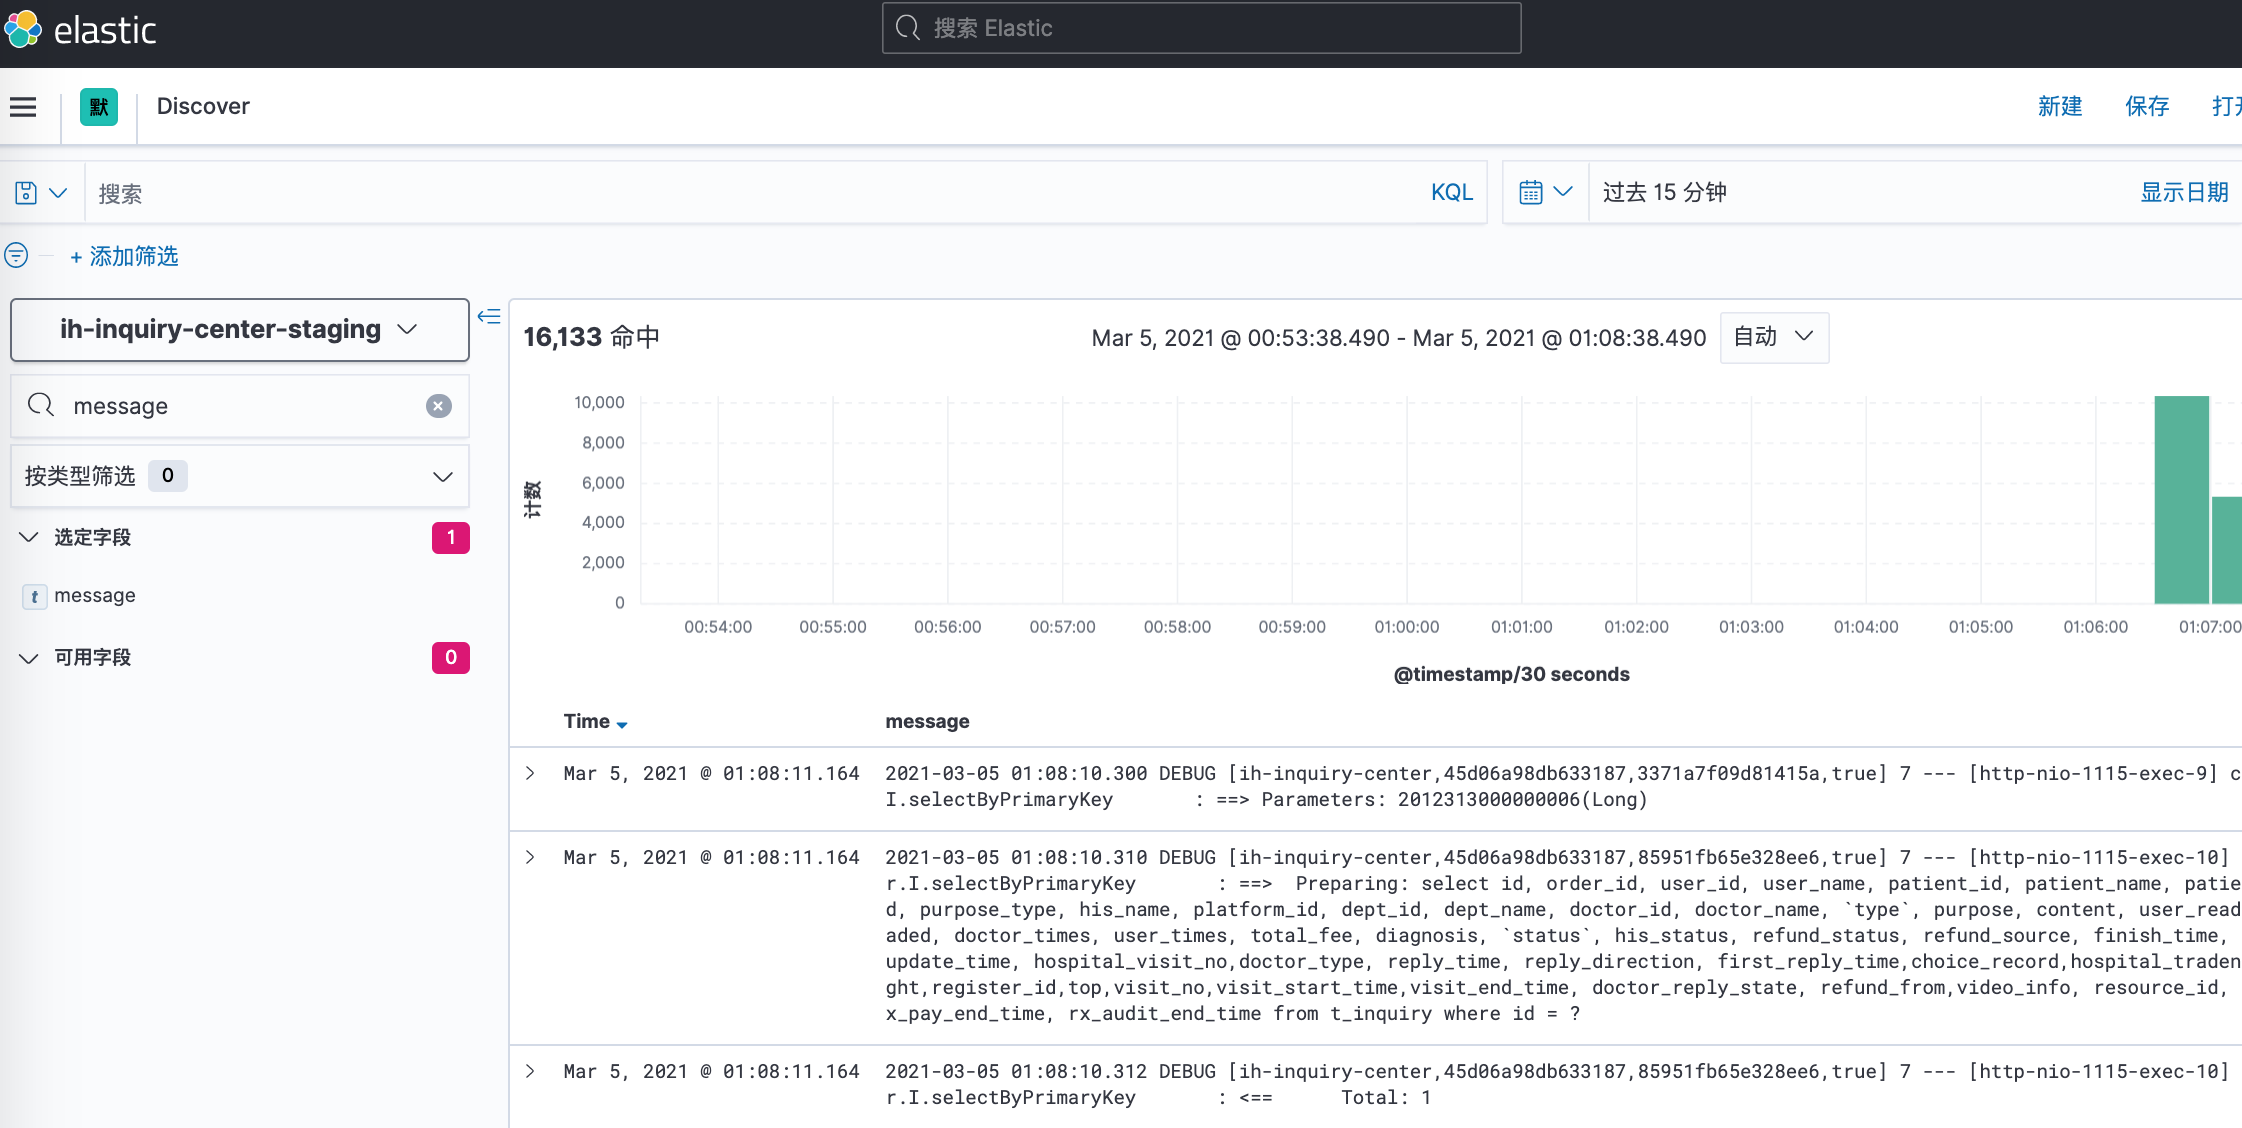
在discover界面查看效果
Java项目实践
配置日志模版
-
application.properties
logging.pattern.console=[%X{logId}] %clr(%d{${LOG_DATEFORMAT_PATTERN:-yyyy-MM-dd HH:mm:ss.SSS}}){faint} %clr(${LOG_LEVEL_PATTERN:-%5p}) %clr(${PID:- }){magenta} %clr(---){faint} %clr([%15.15t]){faint} %clr(%c){cyan} %clr(:){faint} %m%n${LOG_EXCEPTION_CONVERSION_WORD:-%wEx}
logging.pattern.file=[%X{logId}] %d{${LOG_DATEFORMAT_PATTERN:-yyyy-MM-dd HH:mm:ss.SSS}} ${LOG_LEVEL_PATTERN:-%5p} ${PID:- } --- [%t] %c : %m%n${LOG_EXCEPTION_CONVERSION_WORD:-%wEx}
logId为自定义日志id
编写日志拦截器
LogInterceptor
@Component
public class LogInterceptor extends HandlerInterceptorAdapter {

    private static final String LOG_ID = "logId";

    @Override
    public boolean preHandle(HttpServletRequest request, HttpServletResponse response, Object handler) throws Exception {
        String logId = UUID.randomUUID().toString();
        MDC.put(LOG_ID, logId);
        return super.preHandle(request, response, handler);
    }

  	@Override
    public void postHandle(HttpServletRequest request, HttpServletResponse response, Object handler, ModelAndView modelAndView) throws Exception {
      	MDC.remove(LOG_ID);
        super.postHandle(request, response, handler, modelAndView);
    }
}
将拦截器加入到Web配置中
@Configuration
public class WebMvcConfiguration implements WebMvcConfigurer {

    @Autowired
    private LogInterceptor logInterceptor;

    @Override
    public void addInterceptors(InterceptorRegistry registry) {
        registry.addInterceptor(logInterceptor).addPathPatterns("/**");
    }

}
这样就能通个日志ID找到一个请求的所有日志了
配置filebeat
参照以上配置中的ih-front-center-ljey-staging配置
查看kibana
使用日志id查询日志

日志定时清理
随时时间的流逝,ES中的日志数据将不可避免的往上增长,但我们一般所需要的日志不过是一个月之内或者更少,那我们应当如何解决这个问题呢?
elatis官方推荐工具curator, 使用该工具可以方便简单的对es中的索引进行管理。
安装
官方提供了多种安装方式,但推荐使用pip方式安装
pip install elasticsearch-curator
配置
curator一共需要两个配置文件,一个是config_file,一个是action_file
- config_file: 描述了基本配置信息,如何与es连接,curator的日志文件存储路径
- action_file: 描述了应当如何操作索引
由于我们使用pip方式安装,没有样板文件,需要自己去官方拷贝一份
config_file
---
client:
  #es地址,默认端口9200,其他端口可使用 192.168.1.13:9201 格式
  hosts:
    - 192.168.1.13
    - 192.168.1.14
    - 192.168.1.15
  port: 9200
  url_prefix:
  # 如果es开启了ssl访问,这里要改成True,但由于Python版本问题,官方也没给出明确的使用方式, 各种兼容问题...
  use_ssl: False
  # 证书
  certificate:
  # 客户端签名
  client_cert:
  client_key:
  ssl_no_validate: False
  # es账号
  username: elastic
  # es密码
  password: 123456
  timeout: 30
  master_only: False

logging:
  loglevel: INFO
  # curator的日志地址
  logfile: '/opt/server/curator/config/curator.log'
  # 日志格式
  logformat: default
  # 不输出elasticsearch和urllib3依赖的日志,这里的elasticsearch不是指es服务端,仅仅是个依赖
  blacklist: ['elasticsearch', 'urllib3']
action_file
---
actions:
  # 1表示第一个action,可以配很多个,我这里只配了一个
  1:
    # action delete_indices 表示删除索引,官方提供了许多的action
    action: delete_indices
    # 描述, 自己随便写
    description: "delete 3 days ago index"
    # 操作,每个action都有自己对应的操作,可见官方文档
    options:
      # 出现异常是否继续
      continue_if_exception: False
      # 覆盖默认的超时时间180, 单位秒
      timeout_override: 300
      # 是否禁止该action, 可以不配
      disable_action: False
      # 忽略空的索引列表,如果以下filters配置过滤出来的索引列表是空的
      ignore_empty_list: True
    # 过滤配置,每一个过滤类型都有自己的配置
    filters:
    # 过滤类型,这里是 模板方式
    - filtertype: pattern
      # 前缀匹配,还有后缀匹配以及正则,时间方式
      kind: prefix
      # 值, 该过滤器表示过滤以ih为前缀的索引
      value: ih
      # 排除,默认False,可不配,改为True则表示匹配除了以ih开头的索引
      exclude: False
    # 过滤类型 年龄方式
    - filtertype: age
      # 过滤方式, 以索引的creation_date(创建时间)进行过滤
      source: creation_date
      # 方向,older表示以前的,也有以后的
      direction: older
      # 单位 天
      unit: days
      # 3天 该过滤器表示过滤3天之前创建的索引
      unit_count: 3
启动
curator --config /opt/server/curator/config/config.yml /opt/server/curator/config/action.yml
注意config.yml 和 action.yml一定要写绝对路径
查看日志
可去kibana中查看是否删除成功
配置定时执行
由于curator并不像后台程序一样会一直在后台运行,它只执行一次,所以我们需要借助linux的定时功能实现定时执行curator
#编辑定时任务
crontab -e
#编写配置 每天0点0分执行
0 0 * * * /usr/local/bin/curator --config /opt/server/curator/config/config.yml /opt/server/curator/config/action.yml
#重启
service cron restart
第一次会让你选择编译器,如果选错编译器了要更改编译器 输入 select-editor 重新选择